How to Get Started
spatialGE provides a collection of methods for the visualization and spatial analysis of gene expression using spatial transcriptomic experiments (e.g., Visium, SMI, or MERFISH). Users are not limited to those platforms: if gene counts and spatial coordinates of each of those counts are available, they can be analyzed in spatialGE (see “Upload data in generic format”).
Uploading Visium experiments:
Many researchers have used Visium for spatial transcriptomics experiments. In spatialGE, users can directly upload Space Ranger outputs for analysis. The required files are:
-
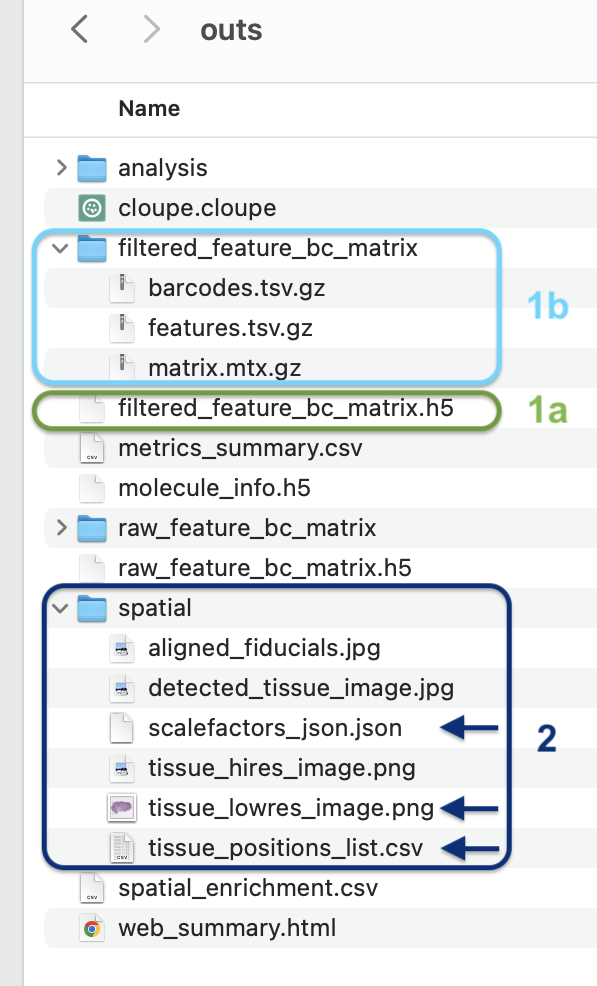
Gene expression data in the form of .h5 files, one per tissue sample. The Space Ranger workflow outputs two .h5 files, however the file used in spatialGE is named filtered_feature_bc_matrix.h5 (see 1a in figure below).
- (To be supported soon) If the filtered_feature_bc_matrix.h5 is not available, users can upload the expression data in the Matrix Exchange (MEX) format provided by Space Ranger (see 1b in figure below).
-
Spot coordinate data. The file can be found within the directory “spatial” from the Space Ranger output, and it is named tissue_positions_list.csv (see 2 in figure below).
-
Optionally users can upload the tissue image and its accompanying scaling factor file (see 2 in figure below).
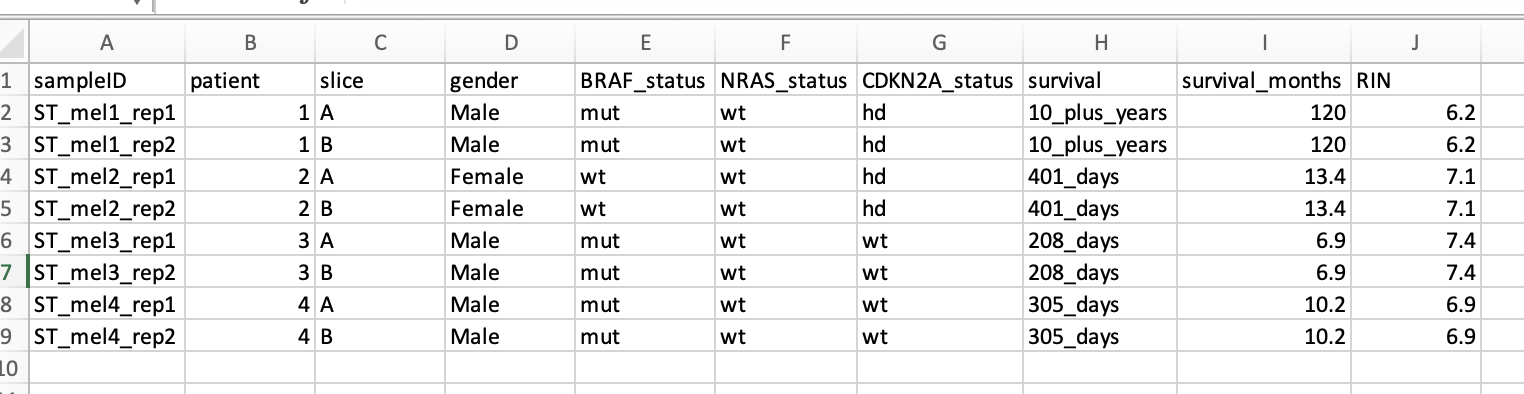
If the user has data associated with each sample (e.g., therapy, overall survival, type of tissue, age of tissue donor, etc), this information can be uploaded in the form of an Excel file or a comma/tab separated file. This file should have the sample names/IDs in the first column, and sample-level information in the subsequent columns (see figure below). This information is required for some of the multi-sample comparison analytical modules.
Uploading spatial transcriptomics experiments using the generic format:
If spatial gene expression data is available in table format, it can also be analyzed in spatialGE regardless of the platform that generated the data. The tables containing gene counts and spatial coordinates should follow the formats described below:
Raw (untransformed) gene counts contained in comma- or tab-delimited files. One for file for each tissue sample. The first column of each file contains gene names. Subsequent columns contain data for each ROI/spot/cell in the sample. Gene-level is information is preferred (as opposed to isoform level). If duplicate gene names are present, they will be appended a number (“.1”, “.2”, etc.).

Coordinates (Y positions and X positions) for each ROI/spot/cell in the sample, one file for each tissue sample. The files should be comma- or tab-delimited. The first column of each file contains the ROI/spot/cell IDs matching the column names for each ROI/spot/cell (columns) in the gene count files. The second and third column are the Y positions and X positions of each ROI/spot/cell.
